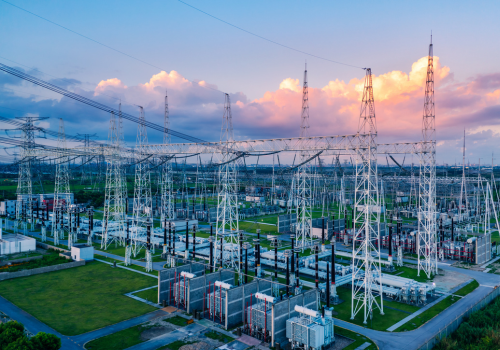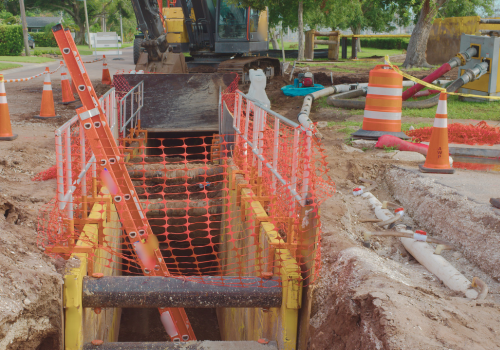
Utility construction work has changed. Reactive project-by-project scopes have given way to proactive, geographically concentrated programs, with multi-year undergrounding campaigns in Florida and California, transmission buildout across Texas and the Southeast, battery storage installations timed to fixed outage windows. These programs run longer, pay better, and create the kind of backlog that justifies fleet investment. The sustained pace of that work reflects demand from data centers, electrification, and industrial reshoring that are driving load growth that utilities are spending years of capital to accommodate. They also expose fleet management gaps that shorter project cycles used to hide.
The companies winning on cost in this market aren't winning because they have more equipment. They are winning because they manage what they have with more discipline. Equipment availability, deployment cost, and utilization rates affect margin directly. In a market anchored by $174 billion in annual utility capital expenditure and programs that reward repeat contractor relationships, fleet decisions made reactively are the fastest path to margin erosion.
Optimization: Matching Fleet Profile to Project Type
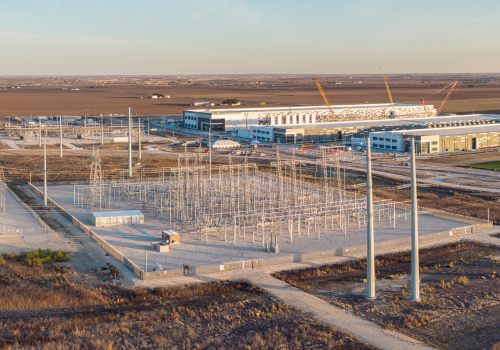
Solar farm prep, transmission line construction, underground distribution, and battery storage installation each have distinct fleet requirements. A fleet optimized for solar grading, dominated by GPS-guided precision and high-cycle excavation, is not the same fleet that performs on a substation project requiring compact equipment, tight tolerances, and careful maneuvering near energized infrastructure. Deploying the wrong equipment profile leads to rework, schedule pressure, and safety exposure.
The AEMP/CFMA Heavy Equipment Comparator tracks annual machine hours, idle time ratios, and downtime as core fleet KPIs, and identifies utilization as one of the primary drivers separating top industry performers from the majority of participants. High-performing utility construction fleets close that gap by pre-positioning equipment for sequential project phases rather than demobilizing between them, keeping machines productive across the full program duration. The gap is a direct cost: idle machines still accrue depreciation, insurance, and holding costs regardless of whether they're working.
Total Cost of Ownership: Building Models That Reflect Utility Conditions
Remote site access in transmission work adds fuel consumption, increases wear rates on undercarriage and ground-engagement tools, and extends response time for unplanned repairs. Precision tolerance requirements for substation grading and battery storage foundations increase cycle times and operator demand on machines. These conditions push maintenance intervals shorter and failure consequences higher than what general construction TCO models assume.
Deferred maintenance compounds faster in high-utilization environments. The AEMP/CFMA Comparator (referenced above) identifies repair and maintenance as nearly 30% of total equipment cost industrywide, a share that grows when preventive maintenance compliance slips under schedule pressure. A skipped predictive maintenance interval on a machine running 12-hour days in remote terrain escalates repair cost faster than on a standard commercial job. In utility construction, the consequences of an unplanned breakdown typically dwarf the repair bill itself in project timeline.
Table 1 below compares the TCO for a mid-size excavator.
|
Cost Category (AEMP/CFMA % of total) |
Industry Average — All Respondents |
Best in Class (Top 10%) |
|
Ownership / depreciation (50.4%) |
$45,400 |
$36,300 |
|
Repair & maintenance (29.9%) |
$26,900 |
$21,500 |
|
Fuel (19.8%) |
$17,800 |
$14,200 |
|
Total estimated annual cost |
$90,100 |
$72,000 |
Table 1: Annual TCO comparison, mid-size excavator (Caterpillar 320 Class, ~$275,000 est. repair value)
Note: Cost-component percentages (ownership 50.4%, repair & maintenance 29.9%, fuel 19.8%) from the 2023 AEMP/CFMA Heavy Equipment Comparator, applied to an estimated replacement value of $275,000 for a mid-size excavator running approximately 1,500 hours per year. Best-in-class figures reflect the top 10% of comparator respondents.
The $18,000 per-machine annual gap between industry average and best-in-class in this model, applied to a 20-machine fleet over a three-year program, equates to $1.08 million in recoverable margin. Each category responds differently to fleet discipline: acquisition timing, predictive maintenance compliance, and utilization management.
Connectivity: Collecting the Most Relevant Data 
Most utility construction fleets have telematics, but fewer use the data systematically. The gap between collecting equipment health and location information and acting on it before it becomes a field problem is where uptime is improved or reduced in compressed utility schedules.
Utilities are deploying digital twin models, SCADA systems, and advanced distribution management platforms across their operations, and contractor documentation expectations have followed. Real-time project tracking, digital work orders, and accurate as-built records are standard requirements now. Fleet systems that automatically log equipment hours, location, and inspection status feed those workflows directly, reducing friction at execution and at contract closeout. They also carry safety and liability weight: equipment incidents on energized infrastructure are tracked across procurement networks, and telematics-driven pre-mobilization protocols provide documented evidence of due diligence when issues arise.
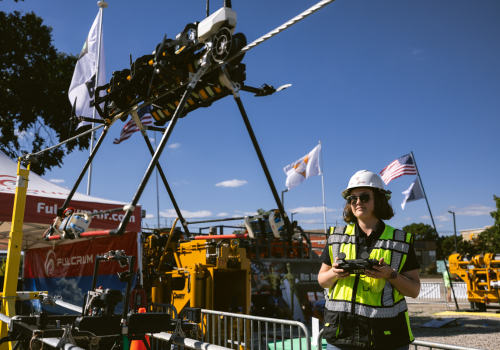
Equipment Safety: Fleet Management as a Procurement Variable
Utilities share safety performance data across procurement networks. More than half of the current utility workforce has less than 10 years of experience, which makes contractor-side safety culture more important because utilities cannot assume baseline field familiarity in the crews working around their infrastructure.
Fleet managers in utility construction carry specific responsibilities that general construction counterparts don't. Pre-mobilization inspection standards for equipment deployed near energized infrastructure are more rigorous than standard pre-job checklists. Operator certifications, such as crane, aerial lift, equipment-specific qualifications, must be verified at the fleet level before deployment. When a contractor cannot produce documentation showing that a certified operator ran a specific machine on a specific date, the exposure goes beyond the safety incident itself. It affects the contractual relationship and future bid standing.
Safety culture in fleet operations either reinforces or undermines your position as a preferred vendor. In addition to evaluating cost and capacity, utilities awarding multi-year framework agreements are evaluating whether a contractor's operations reduce their risk. Fleet management is a visible and documentable part of that evaluation.
The Compounding Advantage
Fleet discipline on one program is the credential for the next one, and for the preferred contractor framework agreements that increasingly define how utilities allocate work.
The 2026 Economic Outlook for the Utility Industry projects utility capital investment sustaining at $174 billion annually, with 42% allocated to transmission and distribution. That level of investment doesn't cycle down quickly. The contractors treating fleet as a strategic function now are building the operational infrastructure to capture it.
Download the 2026 Utility Outlook
Learn how surging demand is creating unprecedented opportunities for utility contractors.
Key takeaways:
- The U.S. is launching its largest power infrastructure buildout in generations, creating major opportunities.
- Clean energy growth is driving massive construction and grid modernization investment.
- Jobs are concentrated in fast‑growing regions, with specialized skills earning top pay.
For fresh insights into the utility industry, along with trends, challenges, and shifts shaping utility work, subscribe to The Utility Expo Newsletter.