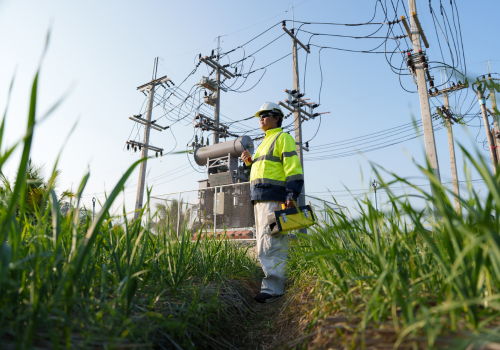
Nearly 600,000 utility workers help ensure people have the electricity, heat, water and digital connectivity needed to live their everyday lives. With employment opportunities and wages both on the rise, 2026 is the perfect time to build a rewarding career as a utility worker.
The total number of utility industry jobs has increased more than 5% since the end of 2022. Unemployment has been holding strong at just 2.6%, according to the U.S. Bureau of Labor Statistics’ preliminary November 2025 data. Average industry hourly wages increased 24% from 2019-2024, and another 3.5% in 2025.
Several factors fuel demand for various types of utility services, including population growth and new infrastructure installation, existing infrastructure replacement, and ongoing maintenance and repair. Thus, there are more employment opportunities in certain parts of the country than others. Employment opportunities may also vary depending on which segment of the broader utility industry a person is seeking employment in.
Let’s take a look at which states and cities have the most jobs and pay the highest wages for the following utility industry occupations:
- Electrical Powerline Installers & Repairers
- Telecommunications Line Installers & Repairers
- Pipelayers
- Water & Wastewater Treatment Professionals
- Solar Photovoltaic Installers
- Wind Turbine Service Technicians
Electrical Powerline Installers & Repairers
Electrical Powerline professionals install and repair cables used in electrical power and distribution systems. Commonly referred to as linemen, they also erect poles and heavy-duty transmission towers.
The latest industry estimate from the U.S. Bureau of Labor Statistics suggests that roughly 127,400 people are employed to do this type of work.
The top 10 states with the most powerline workers are:
- Texas
- California
- Florida
- New York
- North Carolina
- Ohio
- Georgia
- Tennessee
- Pennsylvania
- Illinois
The top 10 U.S. cities (metro areas) with the most powerline workers are:
- New York City
- Houston
- Dallas
- Los Angeles
- Atlanta
- Chicago
- Riverside, CA
- Miami
- Washington, D.C.
- Boston
Powerline workers earn $44.50 an hour as an industry average.
The top 10 states paying the best wages are:
- Washington – $56.02
- California – $55.73
- Alaska – $52.63
- Hawaii – $52.47
- New Jersey – $51.77
- Oregon – $51.67
- Idaho – $51.55
- Massachusetts – $51.32
- New York – $51.09
- Rhode Island – $50.94
The top 10 cities paying the best wages are:
- Bellingham, WA – $67.30
- San Jose, CA – $64.24
- Santa Maria, CA – $63.70
- San Francisco – $61.06
- Redding, CA – $60.80
- Fresno, CA – $59.97
- Poughkeepsie, NY – $59.11
- Olympia, WA – $58.19
- Modesto, CA – $57.93
- Kennewick, WA – $57.57
Telecommunications Line Installers & Repairers
Telecommunications Technicians install and maintain telecommunications infrastructure, including fiber optic lines and equipment that carries communication signals.
There are roughly 268,500 people across the country who do this type of work. Job prospects are actually expected to decline by 3% through 2034. That said, there are still ample job opportunities across the country, particularly in the specialized occupation of “radio, cellular, and tower equipment installers and repairers.”
The top 10 states with the most telecommunications line installers and repairers are:
- California
- New York
- Texas
- Florida
- Virginia
- Georgia
- Pennsylvania
- Ohio
- New Jersey
- Maryland
The top 10 cities with the most telecommunications line installers and repairers are:
- New York City
- Los Angeles
- Washington, D.C.
- Atlanta
- Dallas
- Houston
- Philadelphia
- Boston
- Miami
- Tampa, FL
Telecommunications line installers and repairers earn $33.89 an hour as an industry average.
The top 10 states paying the best wages are:
- Rhode Island – $48.01
- Massachusetts – $46.19
- New Jersey – $45.30
- New York – $42.71
- Alaska – $40.80
- California – $40.60
- Maine – $40.04
- Maryland – $39.01
- Connecticut – $38.80
- Hawaii – $38.35
The top 10 cities paying the best wages are:
- Chico, CA – $48.94
- San Jose, CA – $48.40
- Springfield, MA – $47.37
- San Luis Obispo, CA – $47.34
- Providence, RI – $47.32
- Trenton, NJ – $46.86
- Boston – $46.06
- Vineland, NJ – $45.80
- Worcester, MA – $45.75
- San Francisco – $45.74
Pipelayers
Pipelayers lay pipe for storm and sanitation sewers, drains and water mains. They are also known to grade trenches or culverts, position pipe, and seal joints.
Roughly 34,000 people are employed in this profession across the country, although less than 2% are found within the utility industry. That said, employment within the utility industry is forecasted to grow 2.6% through 2034, with the majority of job gains taking place in the water and sewage segment.
The top 10 states with the most pipelayers are:
- Texas
- Florida
- North Carolina
- Georgia
- California
- Washington
- Virginia
- Indiana
- Ohio
- Alabama
The top 10 cities with the most pipelayers are:
- Dallas
- Houston
- Charlotte, NC
- Austin, TX
- Atlanta
- Seattle
- Miami
- Orlando, FL
- Washington, D.C.
- Phoenix
Pipelayers earn $25.41 an hour as an industry average.
The top 10 states paying the best wages are:
- Alaska – $47.06
- New York – $42.43
- Minnesota – $39.69
- Wisconsin – $39
- Washington – $38.78
- California – $37.02
- New Jersey – $35.73
- Indiana – $33.75
- Michigan – $32.99
- Oregon – $32.42
The top 10 cities paying the best wages are:
- Madison, WI – $43
- Milwaukee – $42.37
- Minneapolis – $40.79
- Seattle – $40.39
- New York City – $40.32
- Buffalo, NY – $40.09
- Bellingham, WA – $38.94
- Albany, NY – $38.90
- Los Angeles – $38.88
- Sacramento, CA – $38.69
Water & Wastewater Treatment Professionals
Water & Wastewater Treatment Professionals operate systems and machines that transfer and treat water or wastewater. There are roughly 132,400 people working in this field, the vast majority of whom are found within local government institutions.
The top 10 states with the most water and wastewater treatment professionals are:
- California
- Texas
- Florida
- Ohio
- New York
- Pennsylvania
- Illinois
- Arizona
- North Carolina
- Virginia
The top 10 cities with the most water and wastewater treatment professionals are:
- New York City
- Los Angeles
- Phoenix
- Chicago
- Houston
- Dallas
- Miami
- Philadelphia
- Riverside, CA
- Washington, D.C.
Water and wastewater treatment professionals earn roughly $28 an hour as an industry average.
The top 10 states paying the best wages are:
- California – $41.59
- Nevada – $39.42
- Washington – $37.75
- Alaska – $37.62
- New Jersey – $36.09
- Connecticut – $35.85
- Illinois – $33.29
- Colorado – $33.24
- Minnesota – $32.80
- New York – $32.77
The top 10 cities paying the best wages are:
- San Francisco – $54.90
- San Jose, CA – $53.15
- Vallejo, CA – $46.45
- Napa, CA – $46.24
- Las Vegas – $42.98
- Sacramento, CA – $42.74
- Salinas, CA – $42.74
- Santa Maria, CA – $41.87
- Seattle – $41.76
- Stockton, CA – $41.45
Solar Photovoltaic Installers
Solar Photovoltaic Installers assemble, install and maintain systems on roofs and other structures that convert sunlight into energy. Common tasks include measuring, cutting, assembling and bolting structural framing and solar modules, as well as performing minor electrical work such as current checks.
Roughly 28,600 people are employed in this field, and jobs are growing considerably faster than the national average for all occupations.
The top 10 states with the most solar photovoltaic installers are:
- California
- Texas
- Florida
- Puerto Rico (not a state, but a U.S. territory)
- Arizona
- New Jersey
- Virginia
- North Carolina
- Indiana
- Colorado
The top 10 cities with the most solar photovoltaic installers are:
- Los Angeles
- Dallas
- New York City
- San Juan, Puerto Rico
- Houston
- San Francisco
- Riverside, CA
- Phoenix
- San Diego
- Austin, TX
Solar photovoltaic installers earn nearly $25 an hour as an industry average.
The top 10 states paying the best wages are:
- Rhode Island – $39.50
- New Jersey – $33.42
- Nevada – $33.37
- Hawaii – $32.42
- California – $31.94
- Vermont – $30.42
- Michigan – $30.35
- Maryland – $29.04
- Ohio – $27.58
- Oregon – $27.33
The top 10 cities paying the best wages are:
- Santa Cruz, CA – $39.30
- San Jose, CA – $36.65
- San Francisco – $35.70
- Kahului-Wailuku, HI – $34.20
- Reno, NV – $34.02
- Salinas, CA – $33.18
- Modesto, CA – $32.77
- Providence, RI – $32.62
- Sacramento, CA – $32.47
- Las Vegas – $32.26
Wind Turbine Service Technicians
Wind Turbine Service Technicians inspect, diagnose, adjust and repair wind turbines. They also provide routine maintenance on electrical, mechanical and hydraulic systems.
Roughly 13,600 wind turbine service technicians are employed across the country.
The top 10 states with the most wind turbine service technicians are:
- Texas
- Iowa
- Minnesota
- Colorado
- Kansas
- California
- Oklahoma
- Washington
- New York
- North Dakota
The top 10 cities with the most wind turbine service technicians are:
- Houston
- Dallas
- Austin, TX
- Denver
- Abilene, TX
- Greeley, CO
- Bakersfield, CA
- Los Angeles
- Amarillo, TX
- Kansas City, MO
Wind turbine service technicians earn a little more than $30 an hour as an industry average.
The top 10 states paying the best wages are:
- California – $41.17
- New Jersey – $40.22
- Pennsylvania – $38.29
- New York – $36.95
- Wyoming – $36.90
- North Dakota – $36.36
- North Carolina – $35.07
- Ohio – $34.95
- Washington – $34.79
- South Carolina – $34.25
The top 10 cities paying the best wages are:
- Los Angeles – $55.02
- Denver – $32.81
- Bakersfield, CA – $32.49
- Houston – $30.75
- Amarillo, TX – $30.67
- Austin, TX – $30.59
- Greeley, CO – $30.37
- Kansas City, MO – $30.07
- Abilene, TX – $29.94
- Dallas – $29.70
In conclusion
Choosing the best states and cities to seek employment as a utility worker largely depends on which sector you aspire to work in, and where you’d like to live and work. Yes, certain states and cities offer more employment opportunities and higher wages. But the industry as a whole is growing, is in urgent need of skilled workers, and is paying higher wages than it has ever paid before. Now is a great time to build a great career as a utility worker—whichever part of the country you choose.
Subscribe to The Utility Expo monthly newsletter to receive more industry insights like this.
Read Next
Why Rural America Needs Fiber Broadband
Drone Applications in Utility Construction: Inspections, Maintenance, and More